In this article, we will help you to understand how to view the utilization of users.
|
Skip Ahead to: Steps to View Utilization of Users |
Overview
The Utilization View page displays the utilization (in percentage) of the personas across all the projects in the organization. This helps you know how a particular persona and the users(resources) within it are utilized/available. For example, if the Architect persona is 90 % utilized (the sum of the utilization percentage of all the users) across all the projects, you can plan the remaining 10 % of the availability for another project.
The utilization percentage of all the users in a specific persona can be seen in the weekly/monthly view on the right side of the screen, which shows how much percentage each user is used on a specific project for a particular duration.
It helps you forecast and plan the utilization of the users more effectively to help you make your organization as productive as possible. Both the users and the organization may benefit from the effective utilization of users. It not only ensures that users have ample work to keep their positions sustainable and lucrative but may also avoid overworking and burnout.
Example
Consider an Architect as a persona, with a Mumbai location and a September to October 2022 duration time.
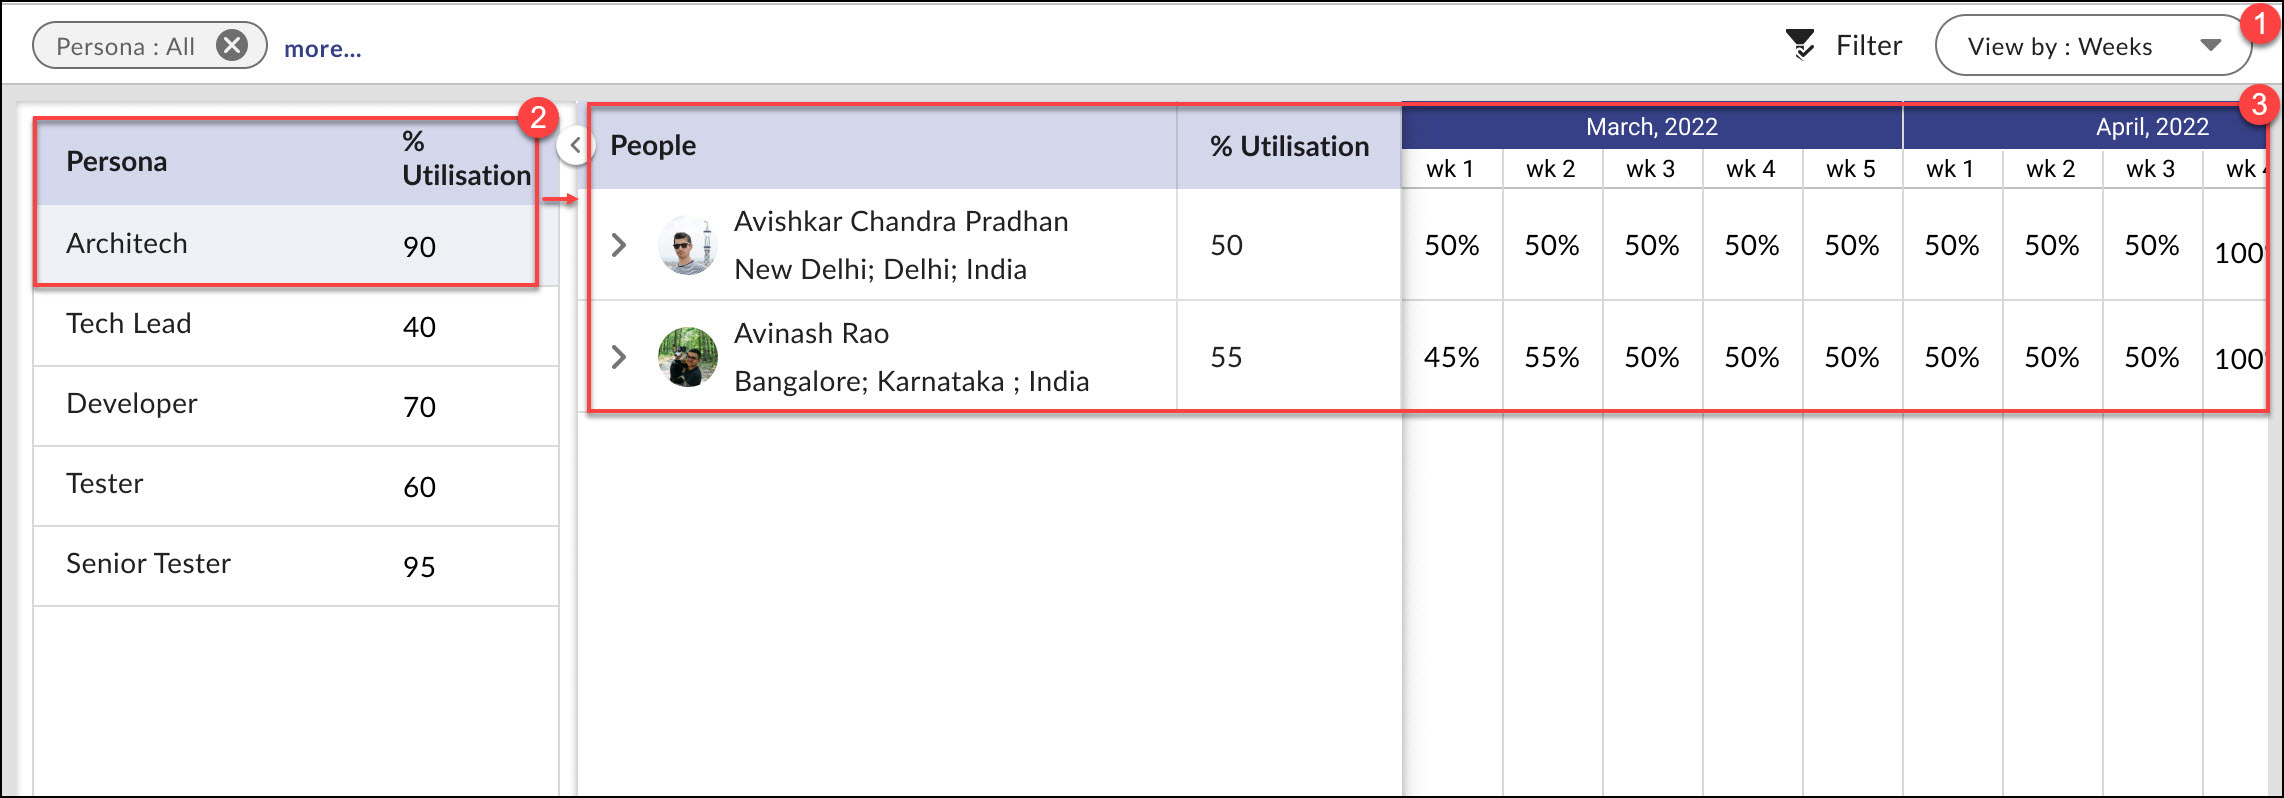
In the given image, the persona panel shows that the Architect persona has a 90% average percentage of utilization, and Avinash and Avishkar are users with 50 and 55 percent of utilization across all projects in the organization. Avishkar is utilized 25% of the time on each project, Ford R & D and Axis Capital Development. The weekly/monthly view shows each user’s and the project’s utilization percentage week-wise or month-wise for a specified duration. The sum of the percentages across the projects is shown for each user.
With this information, it is possible to allocate 50% and 45% of Avinash’s and Avishkar’s time to other projects from March to May 2022 or to increase the allocation percentage for the same projects of the same duration if required.
Navigation
In the left navigation panel, expand the Apps menu and select the Organization name. Hover over the top breadcrumb, expand the People Management module, and select Utilization View.
UI Representation
- Toolbar: The Utilization View’s toolbar consists of three options- Clear All Filters, Filter, and View by option.
-
- The Clear all filters option is used to remove all the applied filters and see all the information without any filtering.
- The Filter option is used to filter out the information based on skills, persona, duration, and location.
- The View by option allows you to view user utilization in weeks or months.
-
- Persona Panel: The persona panel displays a list of the personas that have been selected in the Filter as well as the overall utilization percentage of the personas.
- Utilization Board: The utilization board displays the utilization of users in percentage against their project for the given weeks or months.
Steps to View Utilization of Users
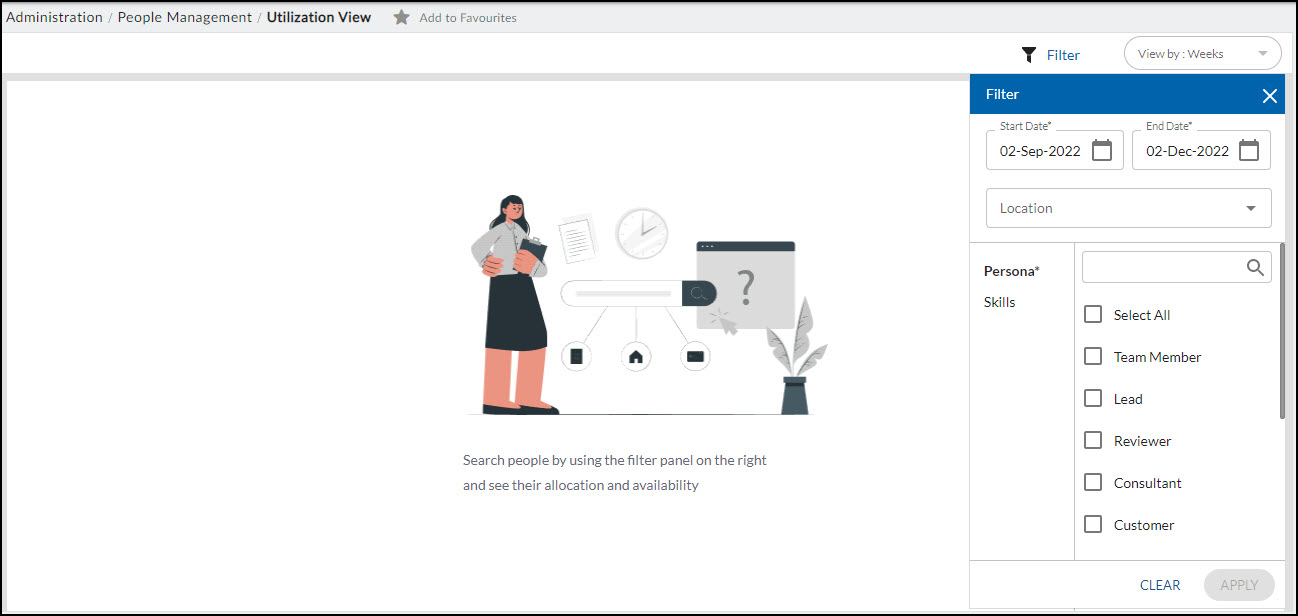
- Click the Filter icon in the top right corner.
- Enter the filter criteria as explained below:
-
- Start Date: The start date from which you want to see the utilization of the users. By default, the start date is taken as three months before the current date.
- End Date: The end date till which you want to see the utilization of the users. By default, the current date is taken as the End date.
- Location: The location of the persona
- Persona: Search and select the type of persona using the drop-down.
- Skills: Select the mandatory or optional skills of the persona.
-
- Click the APPLY button. The user utilization view for the selected personas will be displayed.
Notes:
- The Utilization View screen will appear blank until you select the project, location, and other filter criteria.
- To apply a filter to generate the Utilization view there are two mandatory fields: Date Range & Persona.
- When the Utilization view is loaded for a newly created enterprise then the default dates should be Start Date: Enterprise Creation Date and End Date should be three months from Enterprise Creation Date. Example: If the enterprise was created on 01-Aug-2024 then the Start Date is 01-Aug-2024 and the End Date is 31-Oct-2024.
- Once the Enterprise Creation date is more than three months old then the Start Date will be three months prior Date and the End Date should be the current date. Example: If the enterprise was created on 01-Aug-2024 and today is 07-Nov-2024 then the Start Date will be 07-Aug-2024 and the End Date will be today’s date that is 07-Nov-2024.
- By default, the persona selected should of the logged-in user who will be the Project Manager as that is the role assigned to the Enterprise creator.
- The same view will be available on the People Utilization page under My Analytics.
Team Member Allocation VS Utilization View
Although these two features may appear to be similar, there are some significant differences:
In the Team Member Allocation, the Project Manager/Resource Manager allocates and manages the required users based on the project’s workload and priority.
However, Utilization View shows the percentage of each persona’s and user’s utilization, which is useful for seeing how a specific user is used across multiple projects. While team member allocation organizes your users in the project, the utilization view is what makes it successful.
Benefits of Utilization View
User utilization enables you to maximize the use of your available users:
- Visualize how the personas and users are being utilized so that you can respond more quickly if your budget changes or a user is lost.
- It makes sure that users are being used effectively.
- It shows the persona, as well as a list of users and information on how they are being used.
- It helps the project managers or resource managers to be flexible and reschedule users to prevent issues from getting worse.


