Lead Time & Cycle Time Metrics: What Do They Reveal?
- 8 mins read
-
By Marjan Venema
- Updated on April 26, 2024
Navigate to
What Are Lead Time and Cycle Time?
-
Cycle time now goes by ‘system lead time’.
-
Lead time now goes by ‘customer lead time’.
It’s important to note that ‘customer lead time’ is about a team’s context, not the company’s.
A team’s customers are a product manager or owner who decides what work to do on the product, and the Ops and Support people who take the team’s work into production.
What Is Cycle Time?
In Kanban, cycle time is defined as the time it takes from when you start work on a user story that’s ready for implementation, to when it’s ready for delivery (release).
In terms of Kanban board columns this is the time from when you move a card from “Ready” (“To do”) to “In progress” (“doing”) to the time when you move that card from “In progress” to “Done”.
Of course, user stories aren’t the only work on a Kanban board and you can measure cycle time for all tasks you track on a Kanban board. For example, bugs that need fixing or research you need to do before you can proceed with a user story or bug fix.
However, if you want to look at cycle time in relation to lead time, you want to focus on items that directly deliver value to the team’s and company’s customers, the user stories.
Does Cycle Time Include Wait Time?
-
an answer from someone.
-
a specific test environment.
-
a colleague to collaborate.
-
the next step in a workflow.
What Is Lead Time?
In Kanban, lead time is defined as the time it takes from a user story being ready for implementation to when it’s ready for delivery (release). This includes the time it’s sitting on the backlog waiting to be picked up.
In terms of Kanban board columns this is the time from when a card is added to “Ready” (“To do”) to the time when you move that card to “Done”.
Lead Time vs Cycle Time: Explaining the Difference
The full picture looks like this:
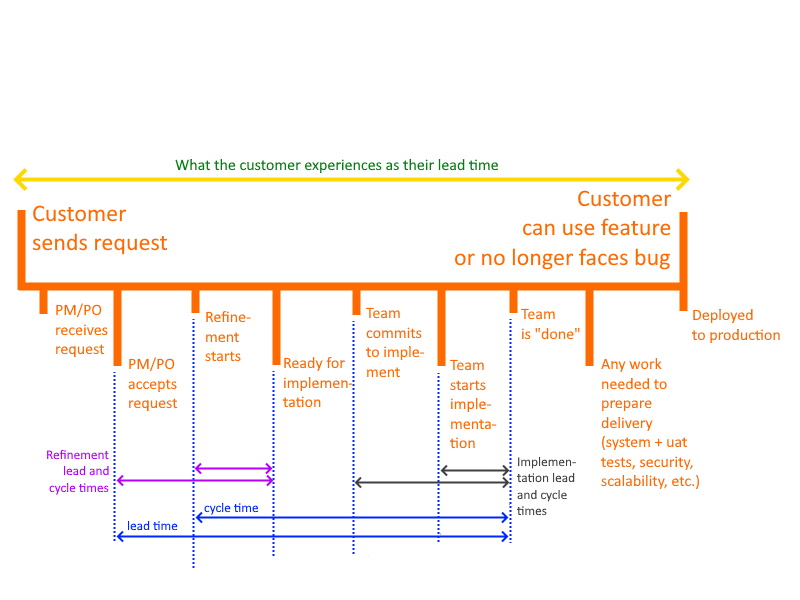
How To Measure Lead Time and Cycle Time
You then have several options to look at and analyze your lead and cycle times.
A common way is to use the cumulative flow diagram. You can measure lead time on it by drawing (and measuring) a horizontal line across the “Ready” and “In progress” phases. And cycle time is simply the width of the “In progress” phase.
Other diagram types may be more intuitive to visualize lead and cycle times.
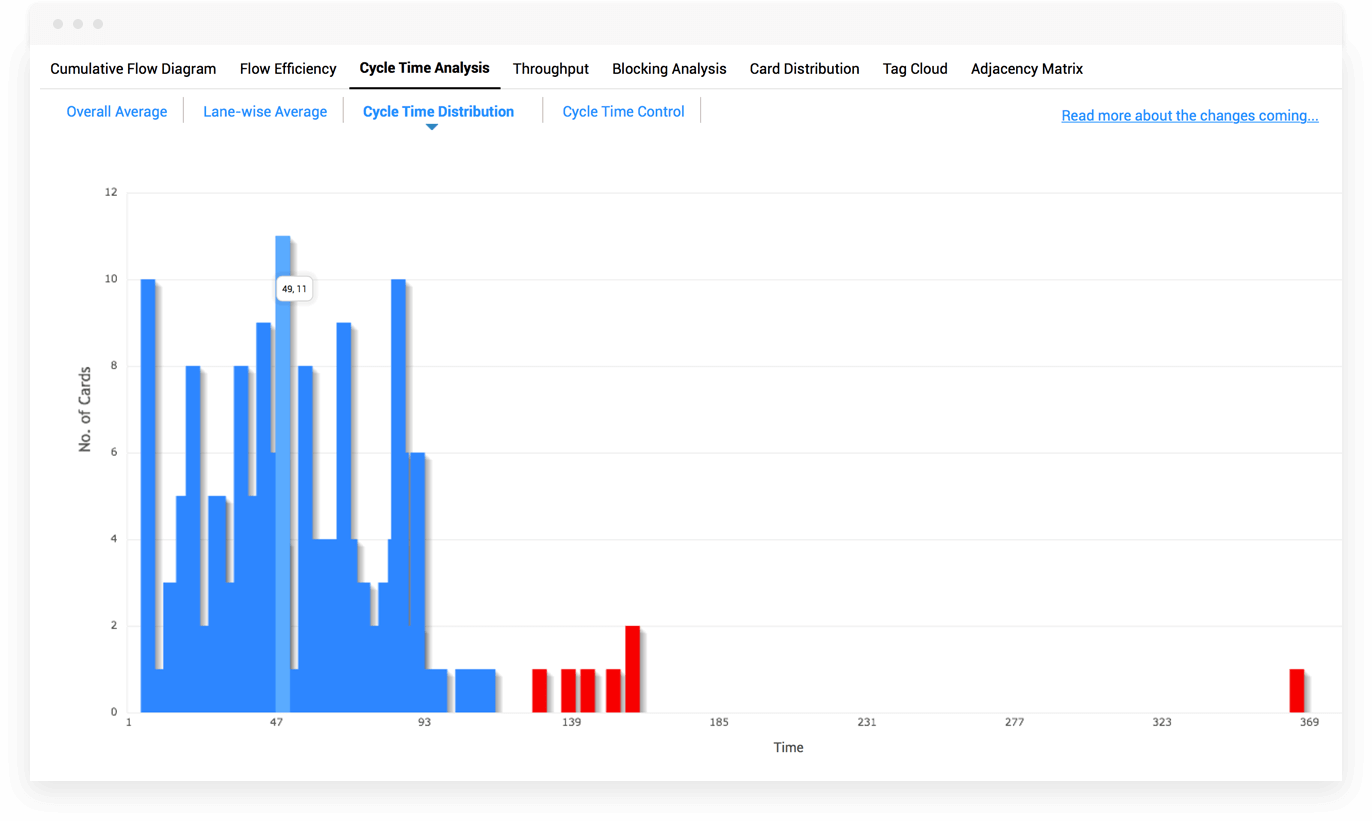
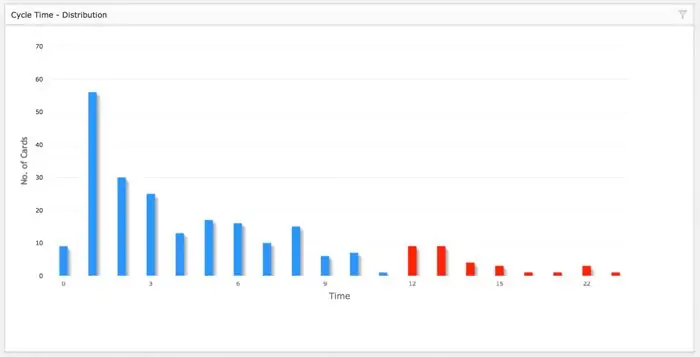
For example, distribution charts that plot the number of cards vertically and the lead and/or cycle time horizontally.
Understanding how to measure lead time and cycle time is crucial for project success. With Nimble, teams can streamline this process effortlessly. Nimble empowers teams to accurately measure the cycle time and lead time of projects with ease. Through comprehensive data tracking and analysis features, Nimble provides real-time insights into the duration of each project stage, from task initiation to completion.
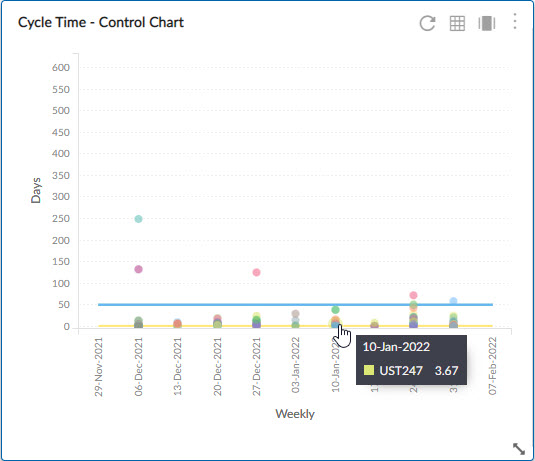
With customizable control charts and intuitive reporting tools, teams can visualize and monitor cycle times effectively, identify bottlenecks, and optimize workflow efficiency. Whether it’s reducing cycle times to improve project delivery or enhancing overall process performance, Nimble equips teams with the tools they need to succeed.
Little’s Law
You can’t talk about cycle time without talking about Little’s Law.
It says that the average number of cards in a stable system is dependent only on the average rate at which work items arrive and the average time a work item is in the system.
Put in Kanban terms:
Work-Items-In-Progress = Arrival Rate * Cycle Time
This is important because it shows that to limit Work-In-Progress, you only have two options:
-
reduce the number of items arriving at your doorstep, or
-
reduce the time you take to get an item from starting work to being done.
What Do Lead Time and Cycle Time Metrics Tell You?
Stable or Volatile
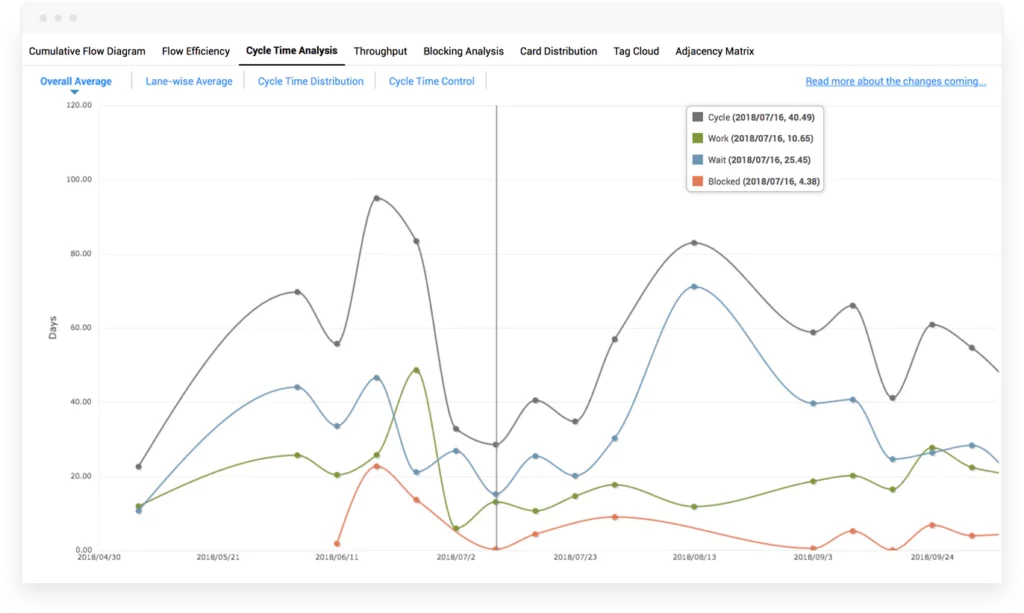
What’s interesting is how stable or volatile these metrics are.
A stable cycle time indicates a team working at a sustainable pace, and not encountering too many disruptions. And a stable lead time indicates stories are coming in at the same pace a team can implement them.
This is what you want as it means you can predict when a team will deliver a story, whether that’s the first up for implementation or further down the prioritized backlog.
A volatile cycle time indicates a team with challenges.
They could be onboarding new members, wrestling with new tools, facing system failures, brittle processes and tests, variability in scope and type of user stories, and anything else that makes it impossible for them to maintain a constant, sustainable pace.
These are all opportunities for improvement that’ll help a team become more predictable in their delivery of value to customers.
A volatile lead time with a stable cycle time indicates work is arriving in leaps and bounds.
The lead time will rise when the rate of arrival is higher than the team’s rate of implementing them. It’ll fall when fewer stories come in than the team can handle.
A team can’t do much about how fast work arrives, but they can set Work-in-Progress (WIP) limits on the number of items ready for implementation and in-progress, to maintain a steady flow.
Lead Time vs Cycle Time Gap
The gap between lead and cycle times is the average time a story sits on the backlog waiting to be implemented.
Though having a lead time equal to the cycle time sounds nice, it actually isn’t because it would mean that team members are regularly twiddling their thumbs waiting for work.
But you don’t want lead time to differ too much from cycle time. Fully refined user stories waiting on the backlog risk growing out-of-date.
What Do Lead Time and Cycle Time Metrics Not Tell You?
Lead time and cycle time don’t tell you how fast you need to implement user stories, or solve bugs, in order to keep up with how fast they’re arriving.
Takt time, another manufacturing metric, can help.
It’s the rate at which you’d need to implement user stories to keep up with their arrival. It’s calculated as the time available for work divided by the number of completed stories needed.
For example, when 20 user stories arrive per week, you’d have to complete stories in 0.25 days to keep up.
Few if any Kanban software products measure takt time.
This is understandable, as hardly anyone in Kanban for software development talks about it. What’s more “time available for work” can get you into all kinds of fruitless discussions about what to include and what not.
The simplest, quickest, and most straightforward way is to just count working days and not bother with the number of developers, their days off, or anything else that affects “developer available time.” That all just gives you a fake sense of accuracy.
Simply counting work days makes the calculation easy and tells you instantly whether it’s feasible, or you need to take more structural measures, like adding a development team, to keep up.
Wait Time While In-Progress
Cycle time includes wait time, but in itself doesn’t give you any insight into how much time a story spends waiting after someone has picked it up.
To get that, separate an ‘in progress’ status into ‘in progress working’ and ‘in progress waiting’. That’ll help you diagnose and address what is causing cycle times to rise. And whether cycle time is indeed falling as a result.
If separating out wait time shows that a lot of your cycle time is actually wait time, it can be a good idea to make a further distinction between internal and external factors. In addition to the ‘in progress waiting’ column, you’d then also have an ‘in progress blocked’ column. And you’d “block” a card when you’re waiting on someone outside the team.
When you have cards blocked more often simply waiting, it’s little use to try and reduce wait time further. You’d have more results chasing the people outside your team!
Variance in Cycle Times
A team’s cycle time is an average. You can have a stable cycle time and still have a significant variance when you look at cycle time for different types of work.
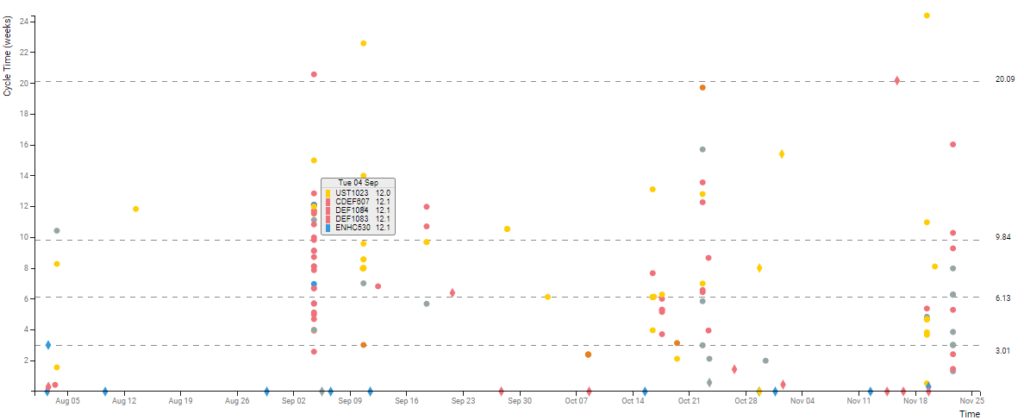
Distribution charts and scatter plots of the cycle times of individual items can help you gain more insight.
If the plotted points on a distribution chart or scatter plot link to the cards they represent, you can easily dig into what the cards in the tail of the distribution have in common—and do something about it.
Coloring the points on these diagrams according to the type of work on the cards they represent, makes it easier to spot patterns and make predictions for similar work in the future.
Get a Grip on Your Process with Lead Time and Cycle Time + Takt Time
Lead time and cycle time give you insight in your own process. Bring takt time into the picture with them and you’ll also get insight into whether you can realistically meet what’s coming at you.
Because when the difference between how fast you need to go and how fast you can go, gets too big, that calls for other measures than running harder.
So, start tracking these metrics, get a grip on your process, and gain the insight you need to know which levers to adjust.
Speed up your Agile planning and execution!
Signup for a FREE Trial of Nimble Agile


