Meaningful, Actionable Insights For your Team's Performance

Advanced Analytics
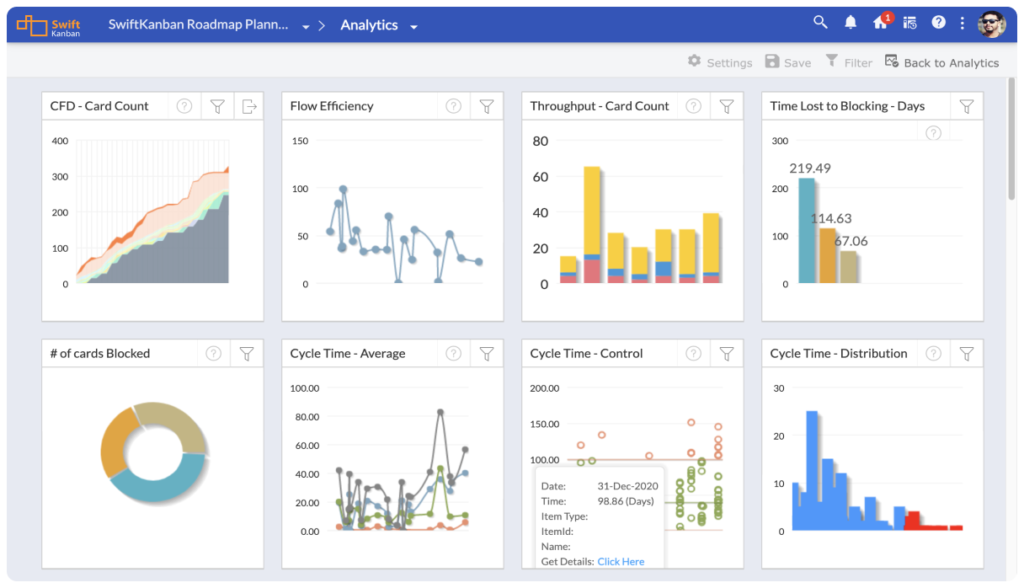
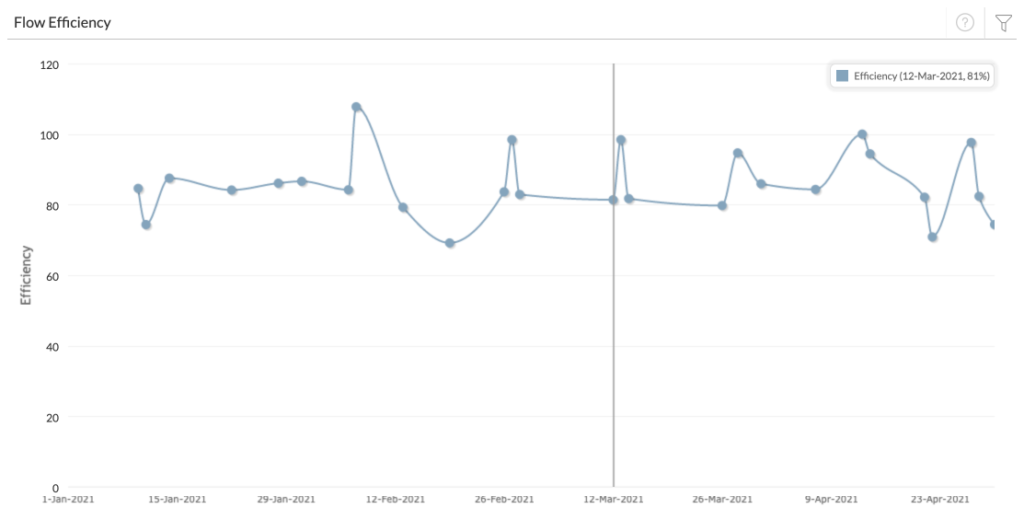
SwiftKanban provides the widest range of Kanban metrics, including Lead/ Cycle Time, Throughput, Flow Efficiency, Blocking Time Analysis, Adjacency Matrix, and several others to help you focus on the right measure for improvement for your business. It ships with a widget-style Analytics view that lets you see all your charts at one glance. Each widget can be resized and filtered individually.
Cycle Time
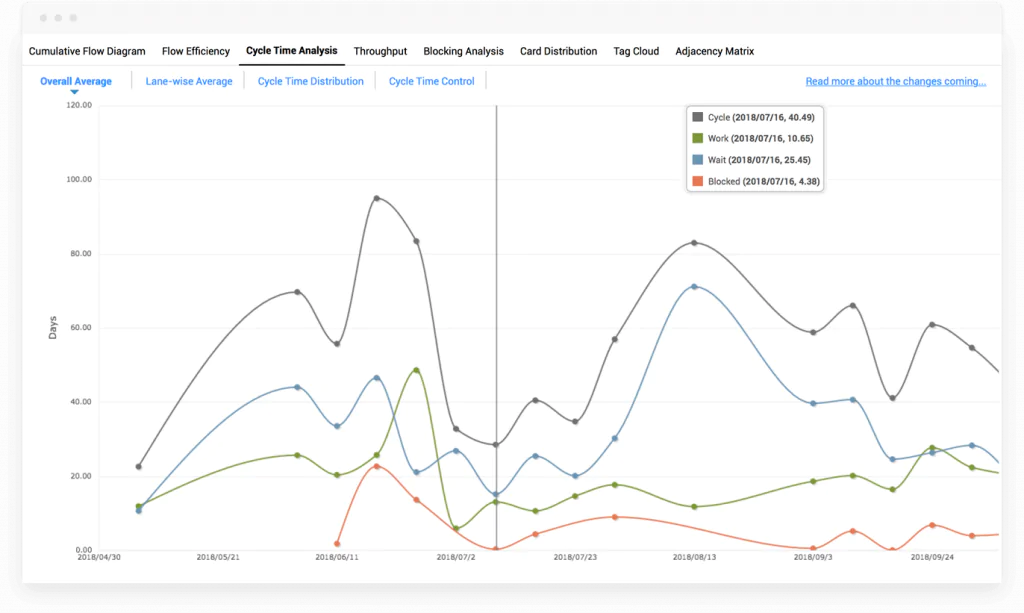
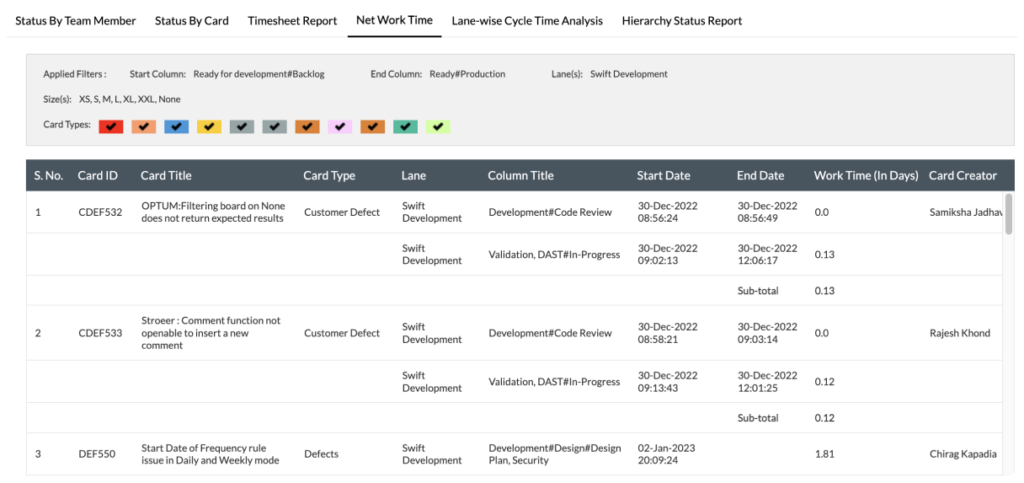
Cycle Time generally represents the time a feature took to get completed, from the time it was prioritized and pushed to the board. Lead and Cycle Time charts present the average amount of time it takes for a task to be processed from the specified start to the finish point. These can be used to analyze the time required to traverse work items and to make improvements in the project performance.
In SwiftKanban, you can view Cycle Time for cards passed through specific columns or stages as an Overall Average, Column-wise Average, Distribution of cards within Cycle Time ranges, and cards within and out of control limits.
Adjacency Matrix
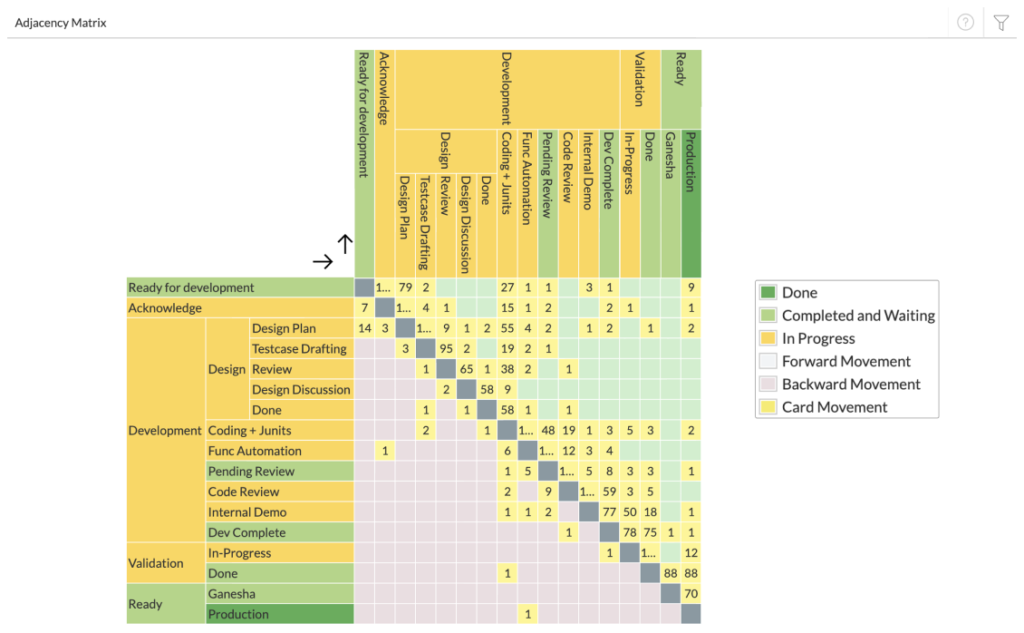
Adjacency Matrix chart shows the movement of cards from one board column to the next. You can track if the cards are following the entire process, column by column or not. If queues are skipped, it indicates that the workflow is not followed, and that there probably is scope for process improvement. This article on the Adjacency Matrix should help!
Blocking Analysis
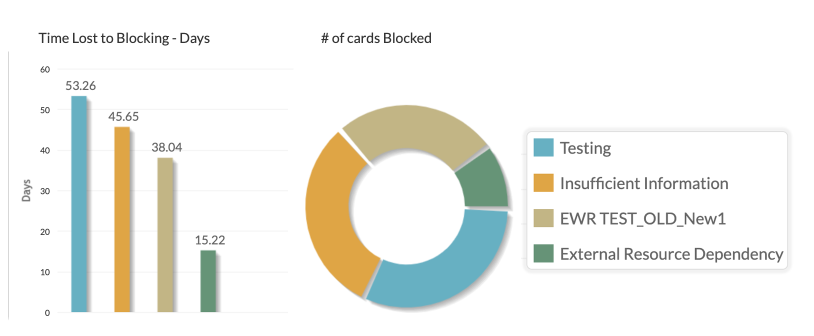
Blocking Analysis provides you some great Root Cause analysis and shows you the impact of blocking on your organization. You can use it to define corrective actions during your next retrospective.
Cumulative Flow Diagram (CFD)
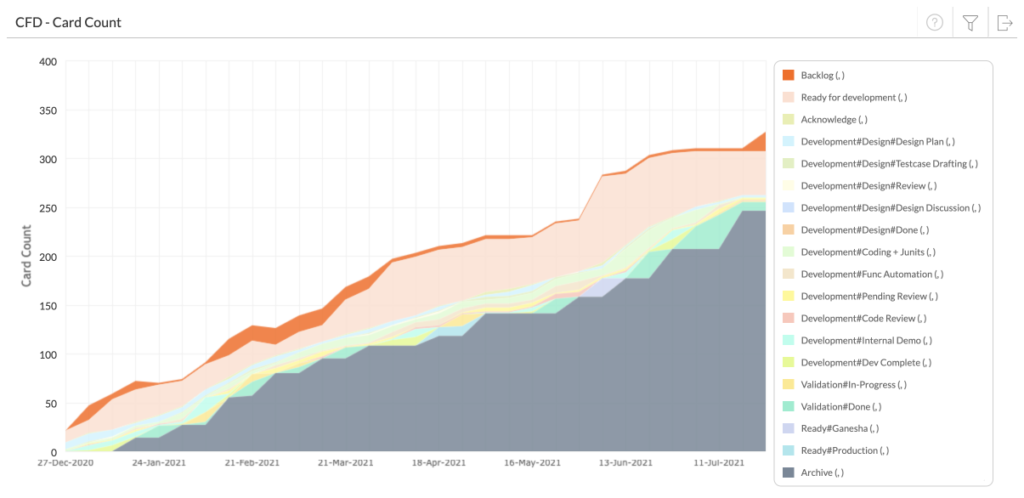
The Cumulative Flow Diagram (CFD) provides a graphic depiction of how cards are moving through various statuses on the way to being ‘Done’. It shows us the total scope of a board, grouped by status, and thus lets us know how much of that scope is in a particular status at a given time. The CFD in SwiftKanban helps to track the performance of the board and how close you are to completing the board on a whole.
Tag Cloud
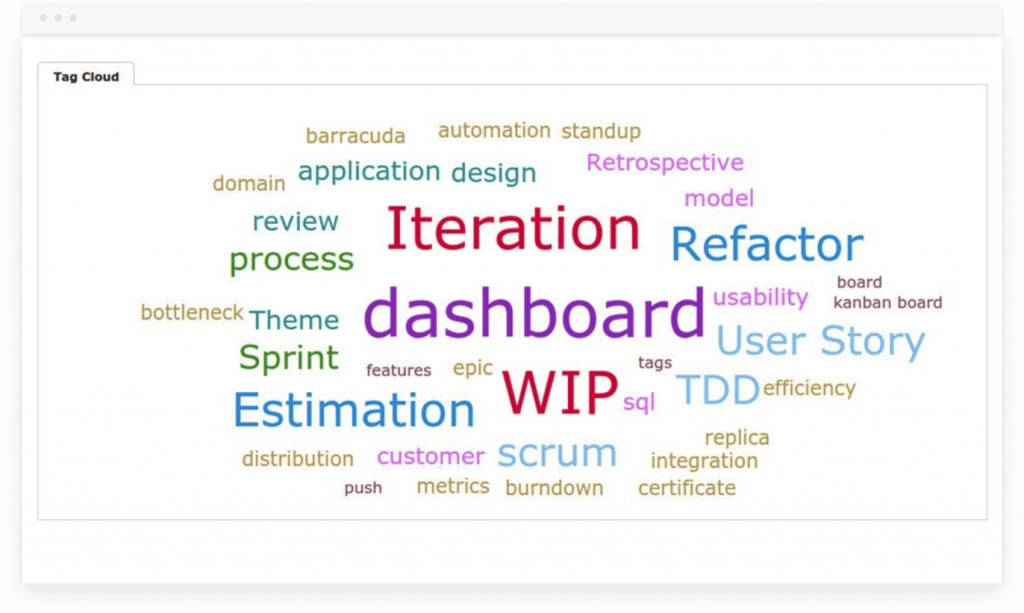
Use the Card Tags to understand what are the key drivers of your Board. You can assign as many Tags to each card as you need. You can use the Tag Cloud to get a quick visual feedback of what are the biggest drivers of your board – customers, technologies, specific themes, etc. (Clicking on the tag gives you the full list of cards contributing to that Tag).
Throughput
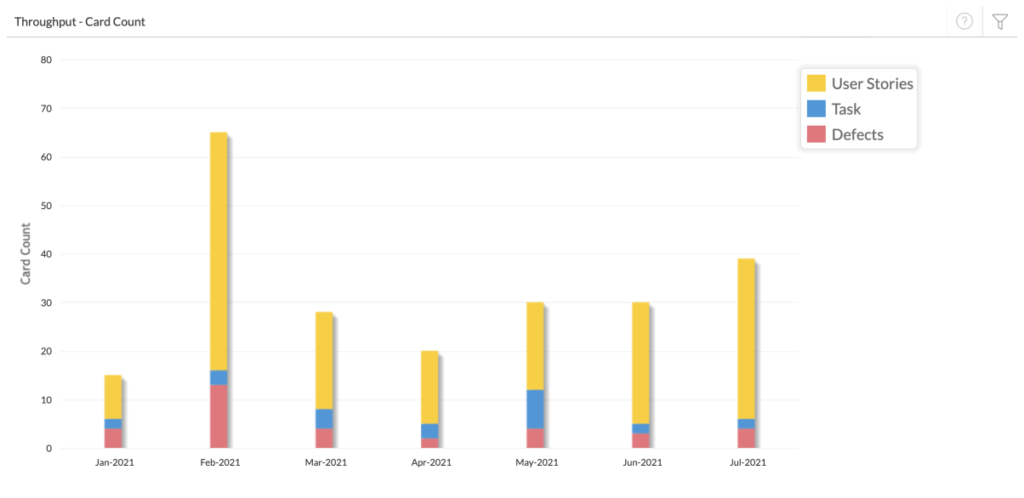
Throughput, which is quite similar to the Agile Velocity metric, indicates the amount of work being done in a given period. The unit of work can be interpreted in terms of user stories, story points or others. Throughput can be a useful indicator in understanding how well the team or the organization is performing against the lead time and the target delivery date and turning stories into working features.
Using SwiftKanban, you can measure throughput in terms of the number of cards delivered for a specified period. You can also track the break-up of the cards delivered, based on a specific attribute such as priority, class of service, size and so on.
Explore Other SwiftKanban Features
Team Kanban
Roadmap
Business Rules
Kanban Integrations
Backlog Management
Scrumban
Kanban Analytics
SwiftESP
Team Collaboration
Enterprise Portfolio Kanban
Enterprise Services Planning with Kanban
Visualize your workflow and manage your work in an Easy and Intuitive way.
Try our Enterprise Plan FREE for 30 days.


